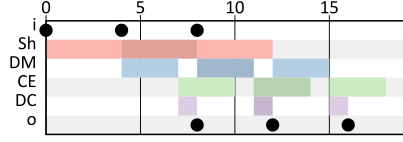
Visualization of the behavior of systems or models of systems helps to understand those behaviors in depth. Gantt chart-like visualizations are very commonly used as they can visualize a logical or physical timeline with quantitative and or ordering. It visualizes atomic actions or activities, logically grouped into ‘swimming lanes’ and the existing dependencies between the actions.
- Eclipse Trace4CPS [1][2] is a Gantt chart viewer for the Eclipse ecosystem that supports various kinds of analyses methods. This Gantt chart viewer is also part of the Eclipse LSAT tool [3]
- The Computational Modeling Work Bench uses Gantt charts to visualize schedules of dataflow graphs. It uses to cmtrace Python library, which is intended to produce visually attractive images of relatively small traces.
- Gantt charts or similar visualizations are also commonly used to visualize (Timed) Message Sequence Charts
- Gantts charts are also a good way to study logging traces such as traces generated by the Activity Execution Engine, which can be collected with OpenTelemetry and visualized with related tools such as Jaeger or Prometheus, or wit the Trace4CPS or cmtrace tools.
References
- (2016): Checking Metric Temporal Logic with TRACE. In: 2016 16th International Conference on Application of Concurrency to System Design (ACSD), pp. 19-24, 2016.
- (2012): Reconstructing Critical Paths from Execution Traces. In: 2012 IEEE 15th International Conference on Computational Science and Engineering, pp. 524-531, 2012.
- (2021): LSAT: Specification and Analysis of Product Logistics in Flexible Manufacturing Systems. In: 2021 IEEE 17th International Conference on Automation Science and Engineering (CASE), pp. 1-8, 2021.